Issues in Information Design
COVID-19 REPORT

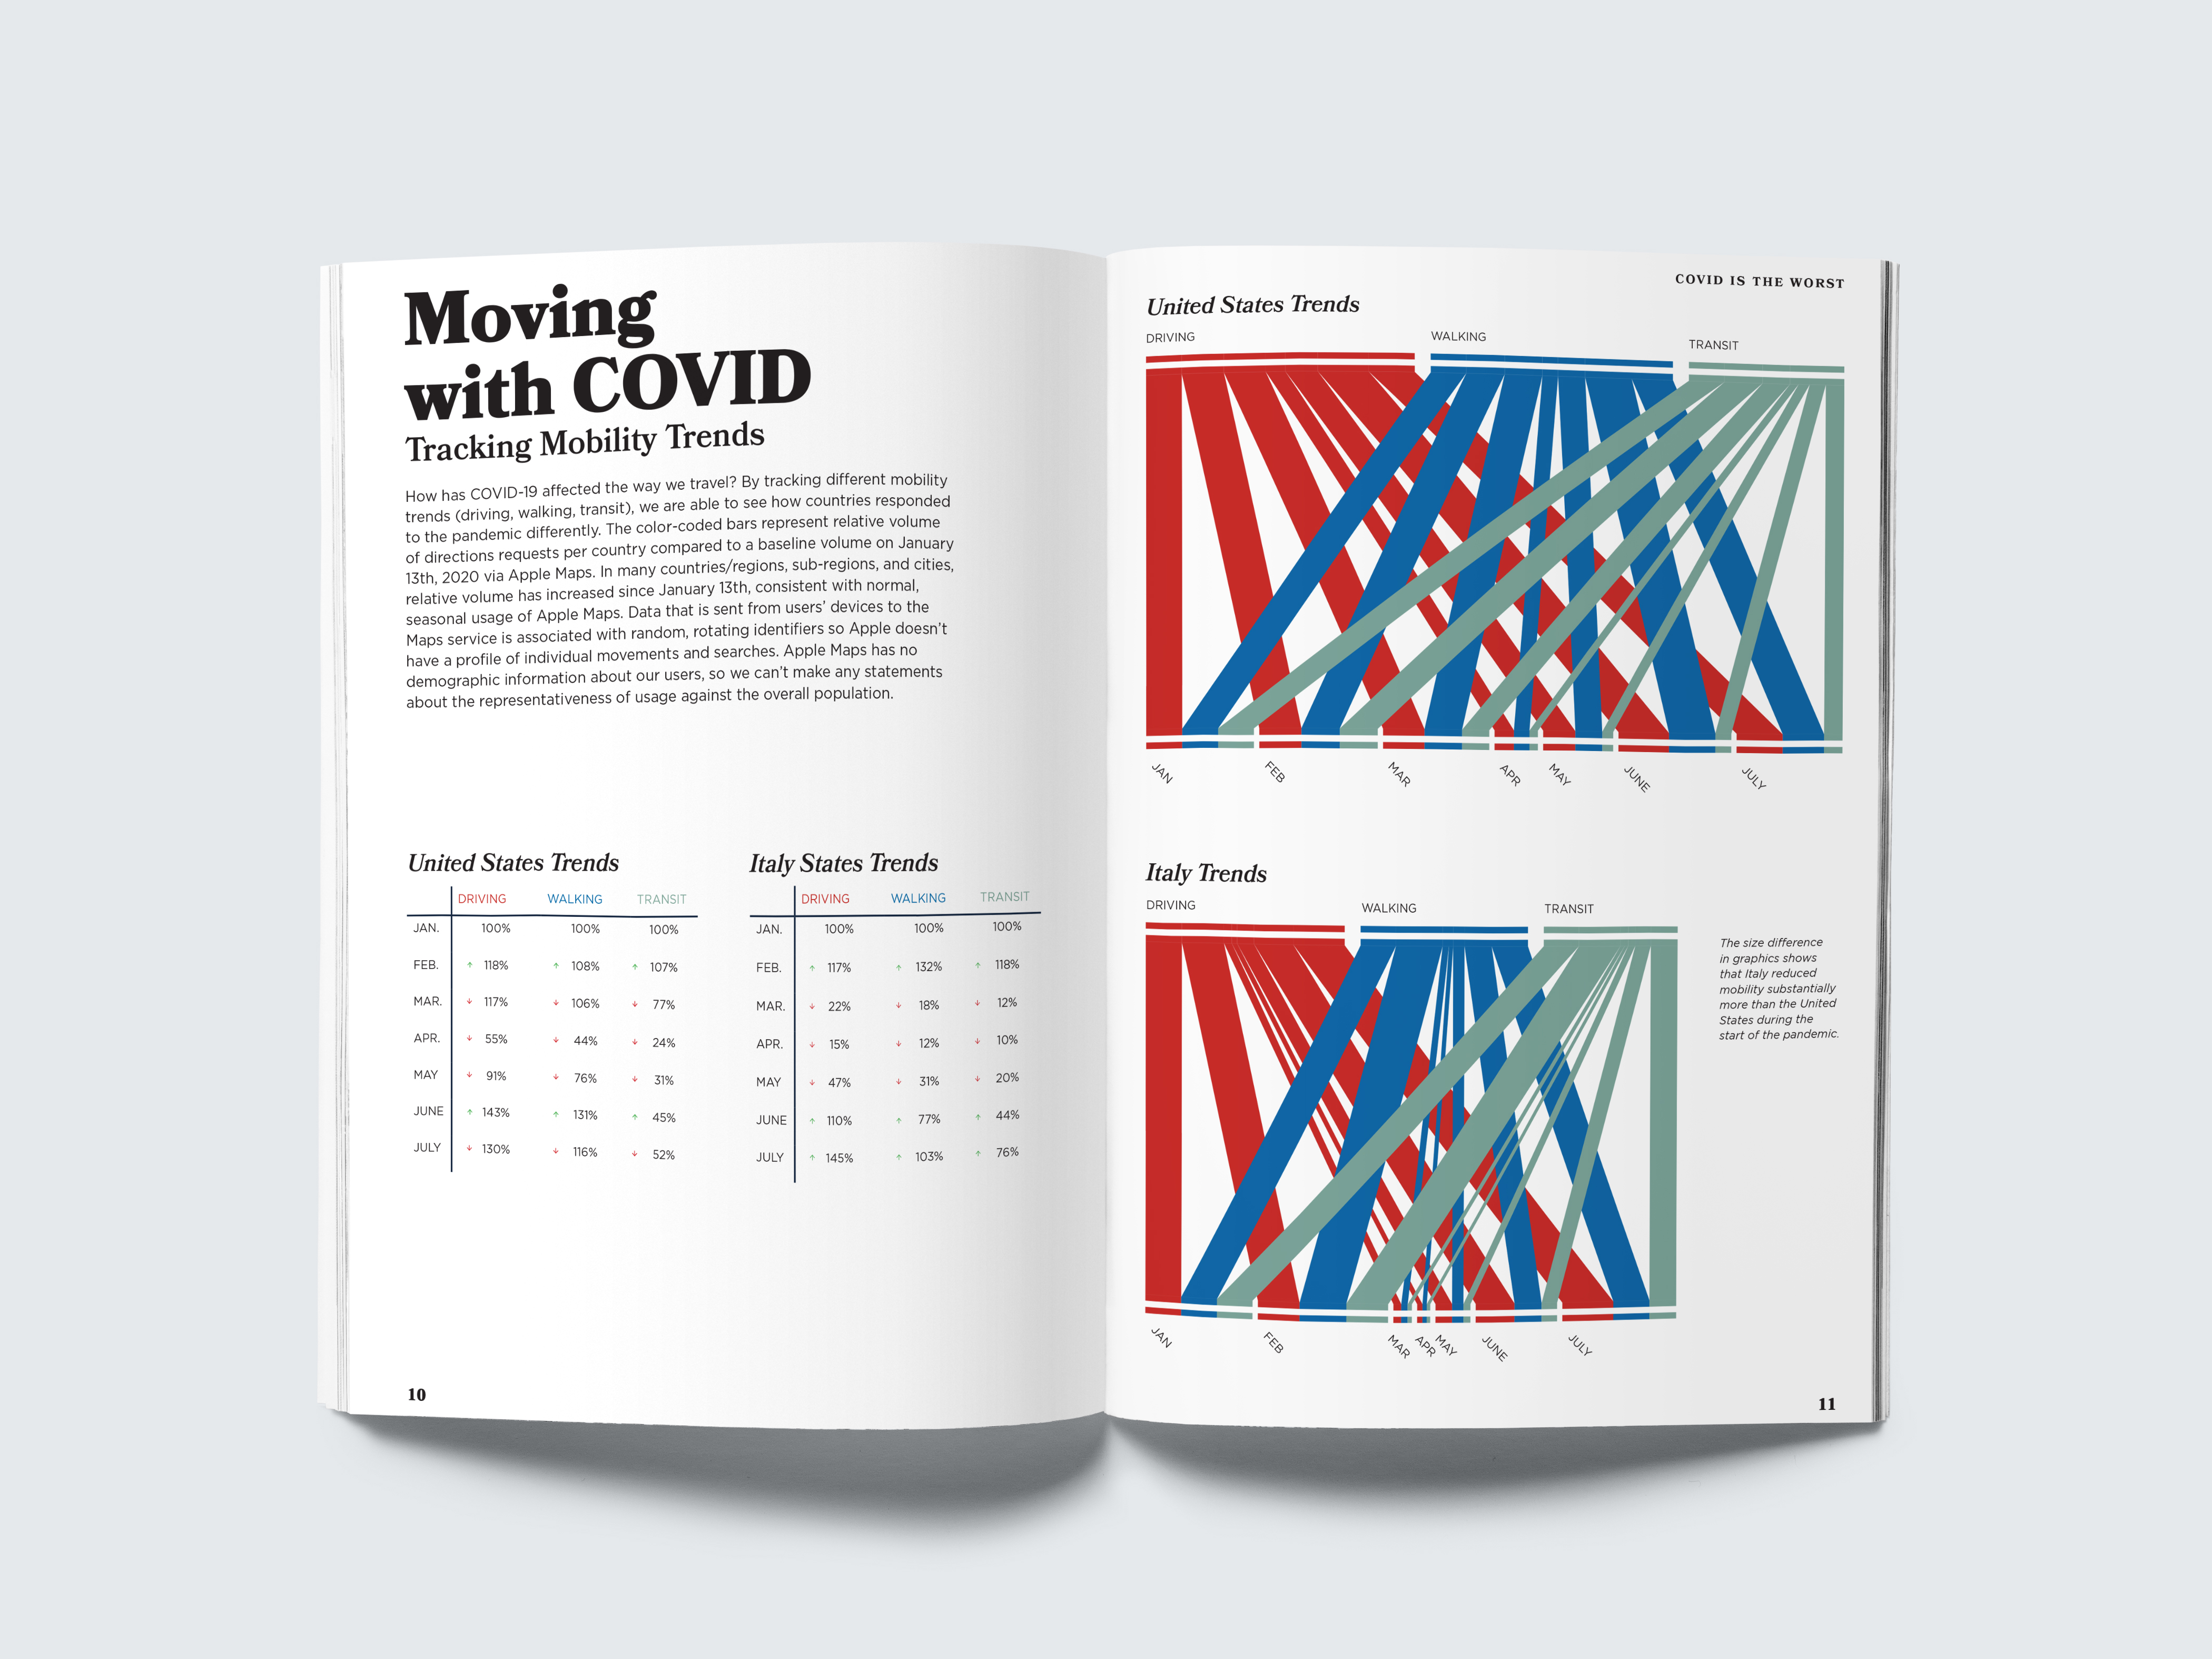
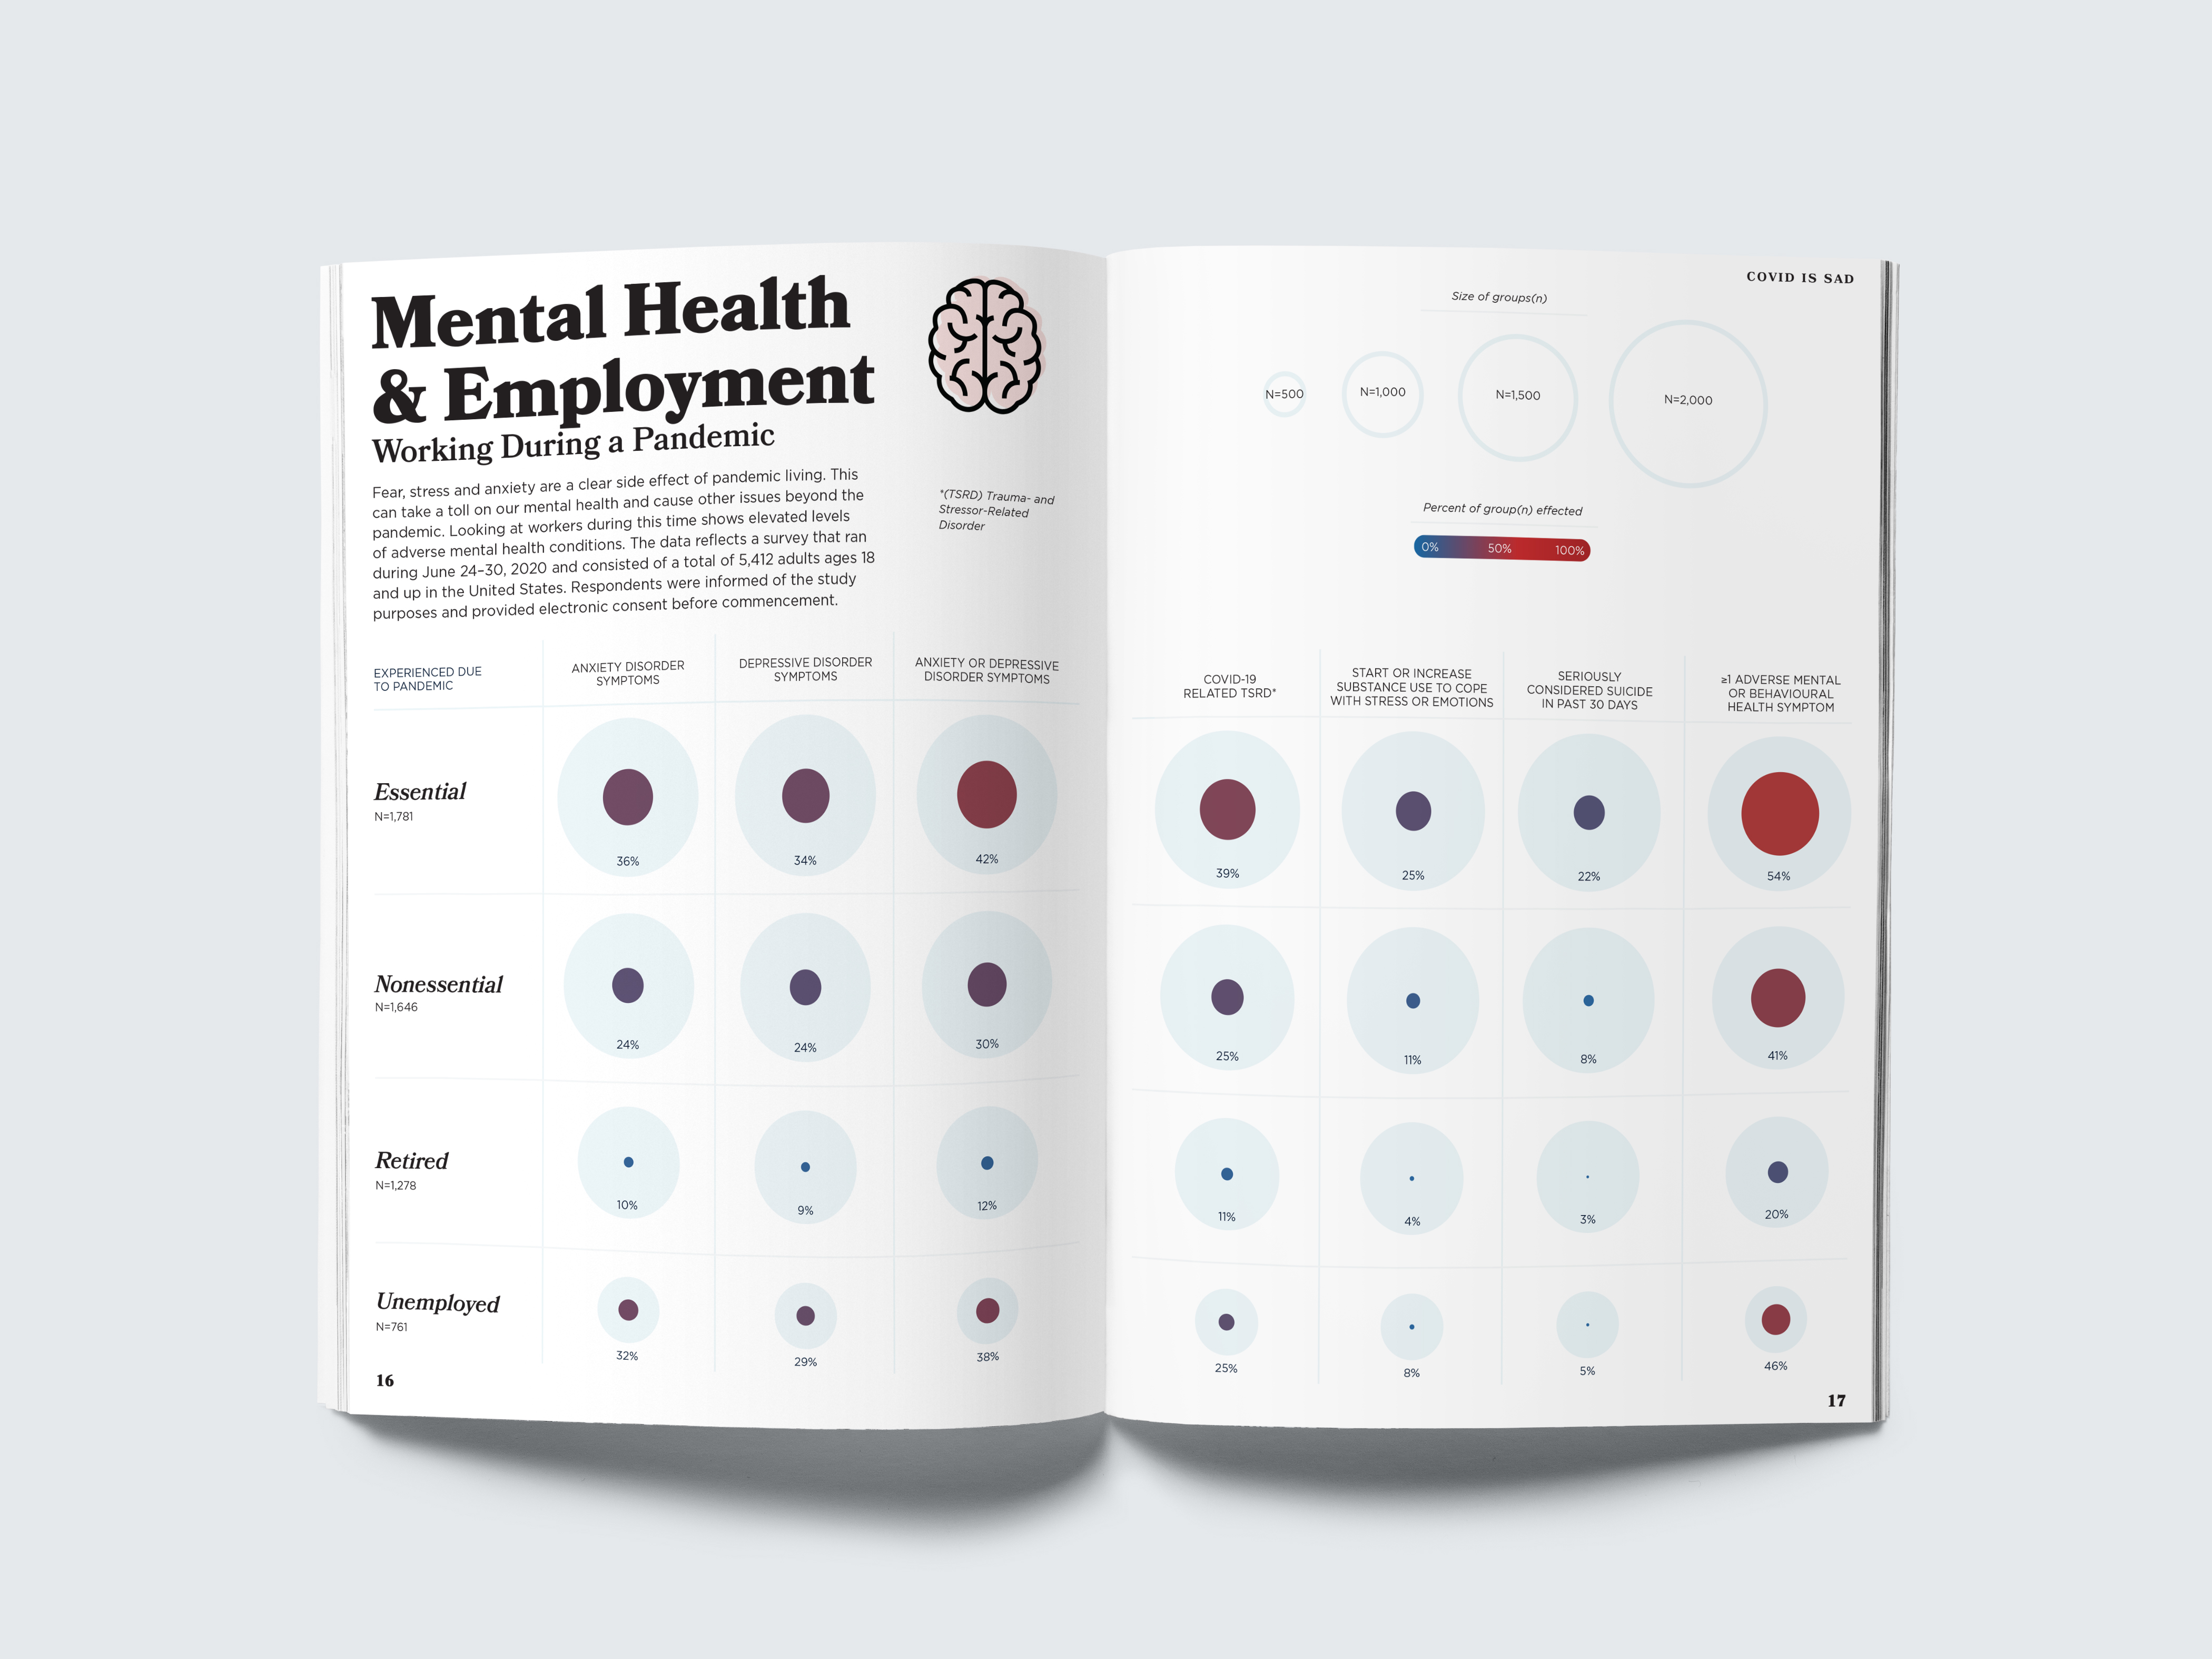

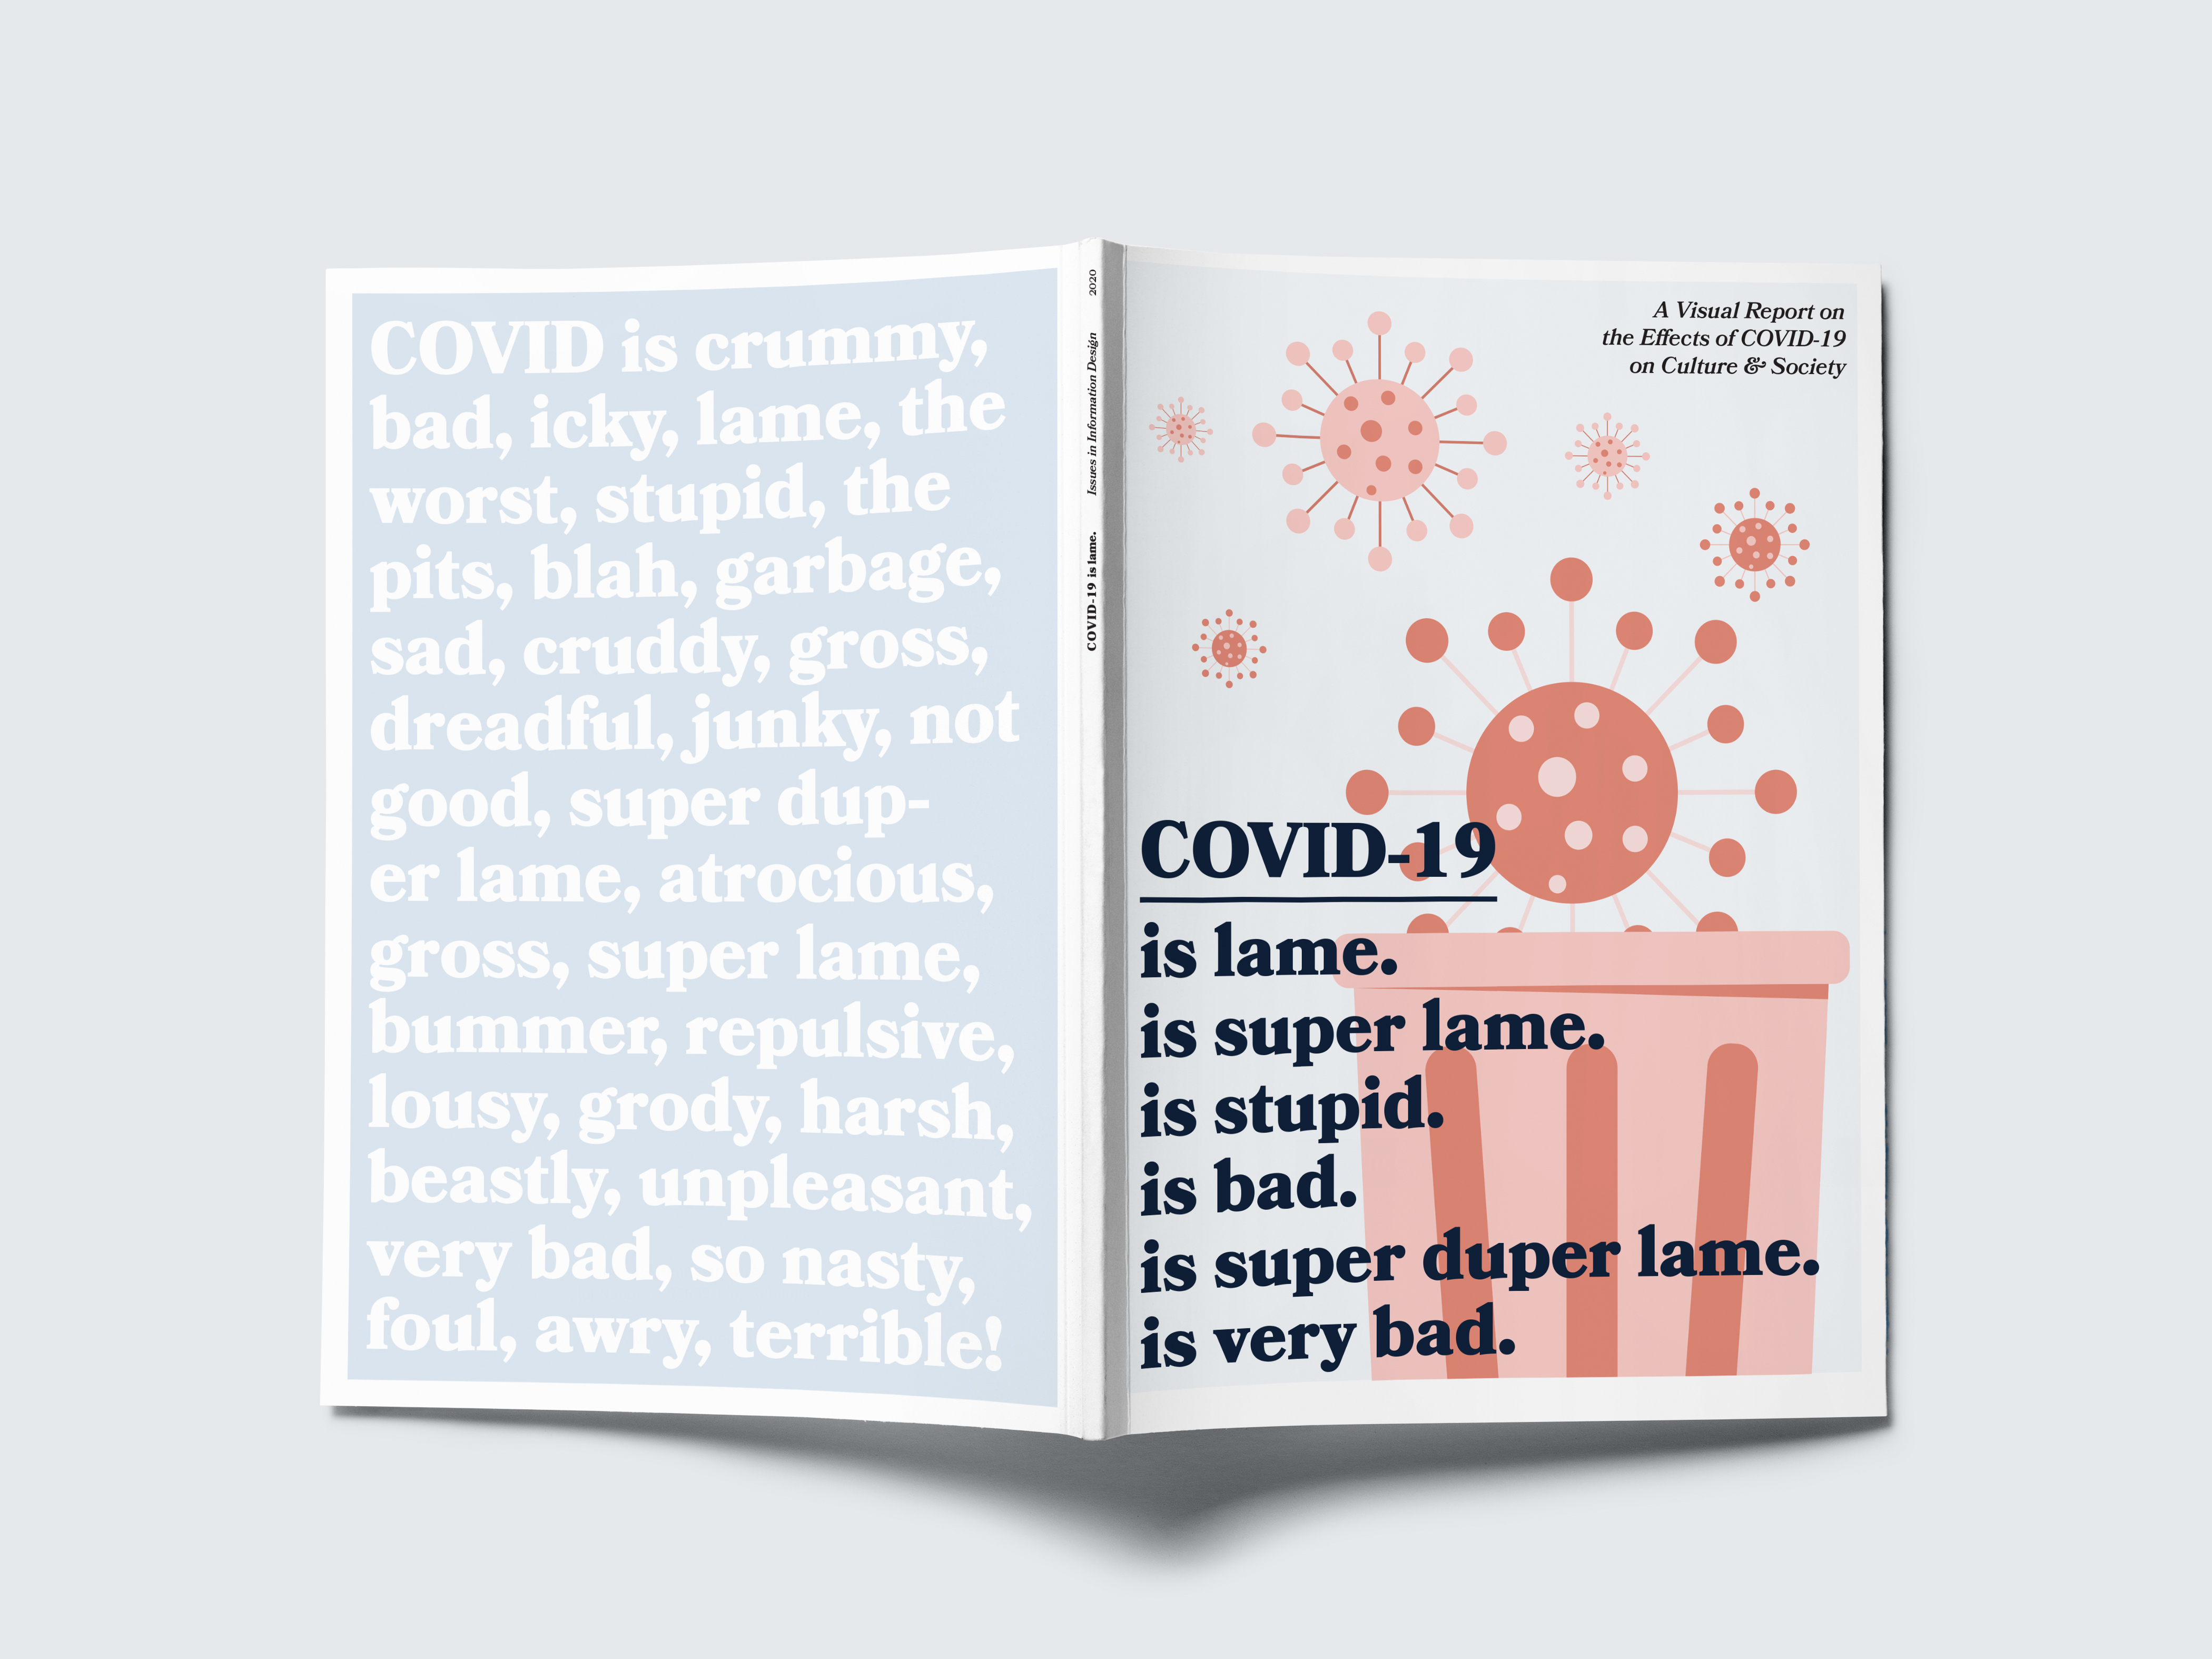
We have all become accustomed to looking at charts that graph the toll COVID-19 has on the human population and the healthcare system. But what about everything else that this pandemic has affected? Students of the Undergrad Visual Communication Design elective Issues in Information Design and the Master’s elective Communicating Health Data came together to use data and design to ponder this question. Thorugh study of the pandemics’ peripheral effects, they uncovered how these effects shape and influence our culture, society, economic, and social behaviors.
BIODIAGRAM
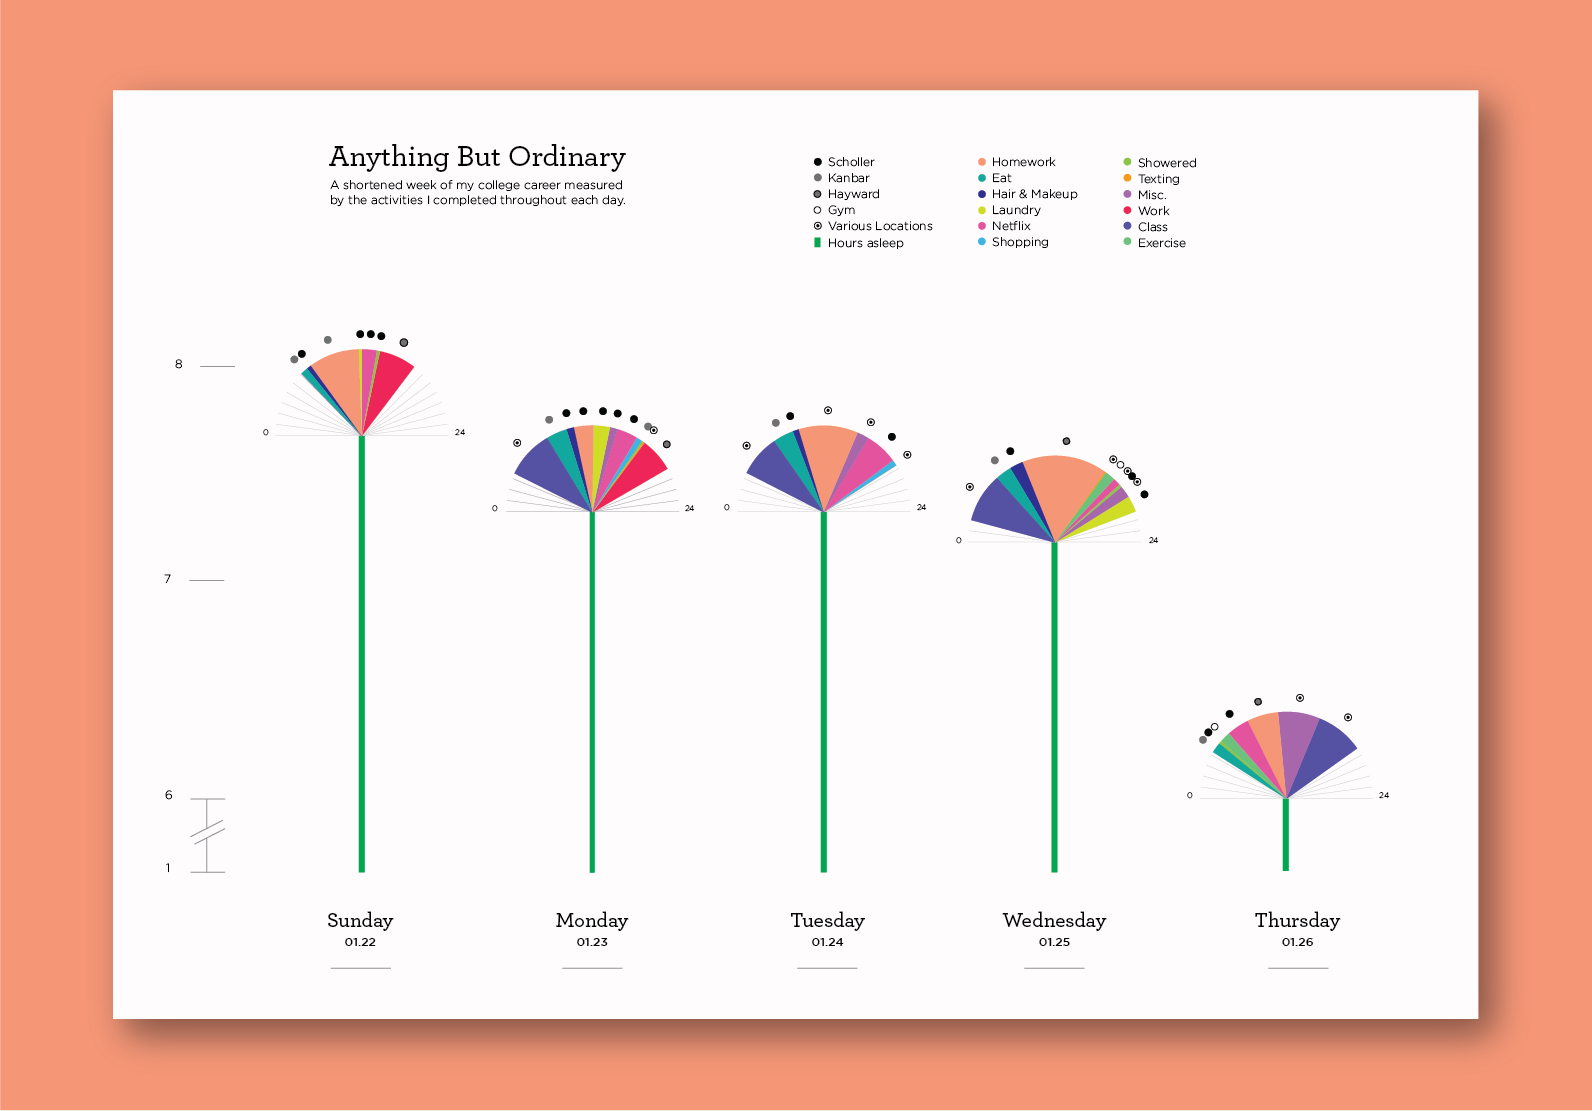

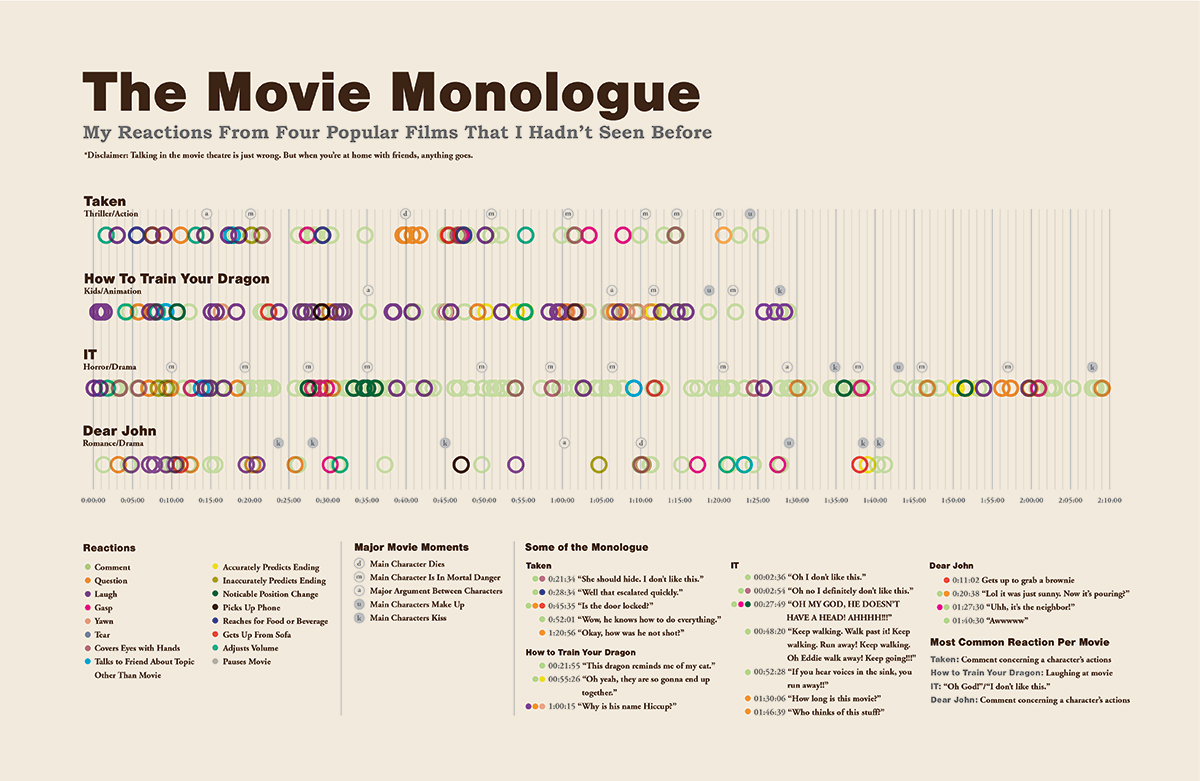

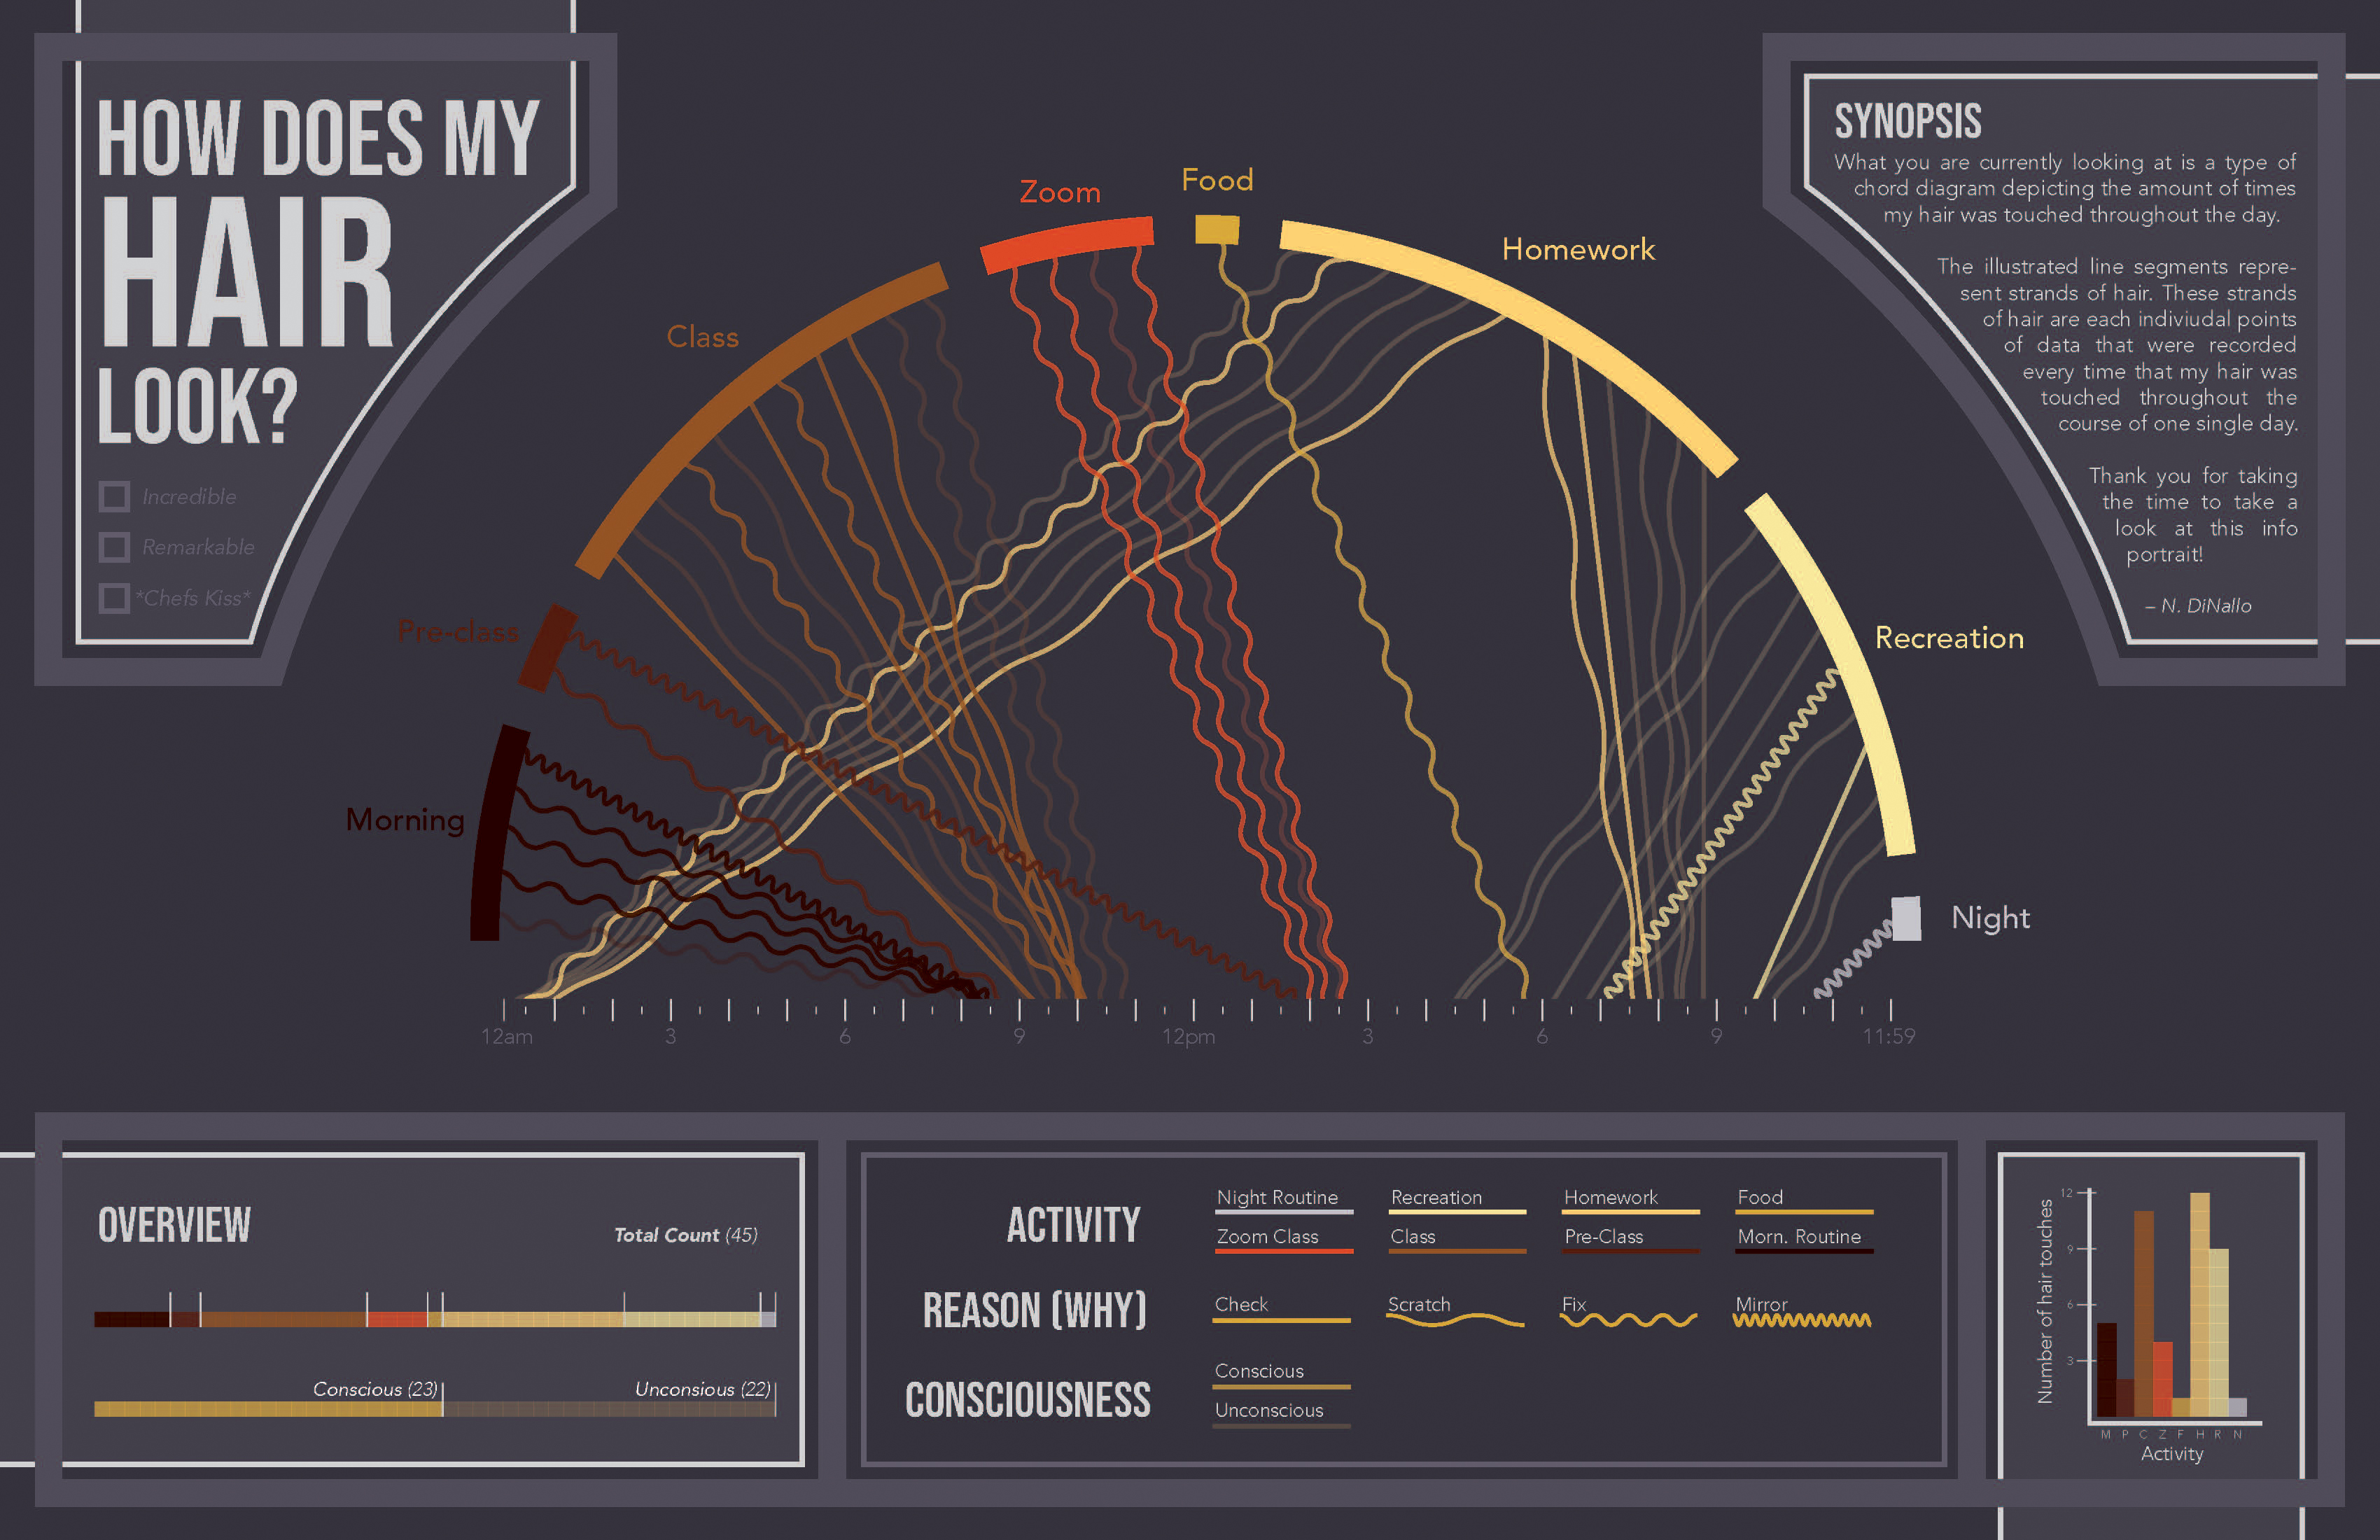
This project introduces students to the basics of creating a diagram. We start by learning the five basic principles of organization for information—Location, Alphabet, Time, Catagory, and Hierarchy. Students then use these organization methods to construct a diagram that tells a story about themselves.
CARTOGRAPHY
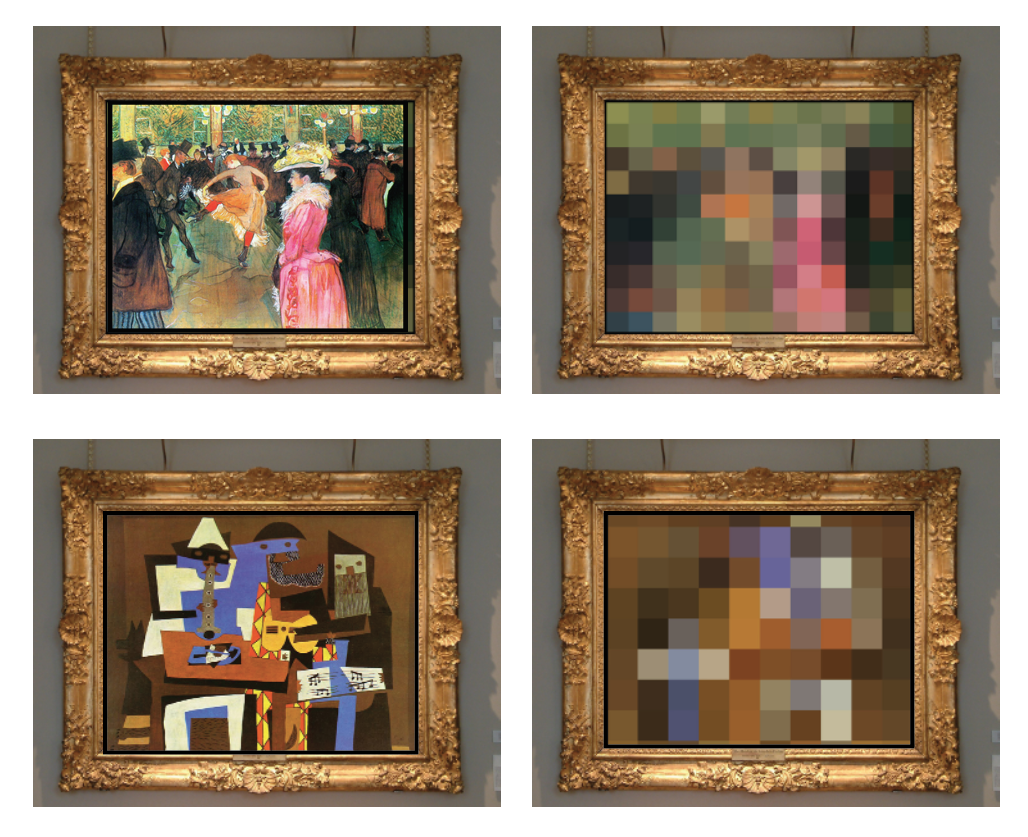
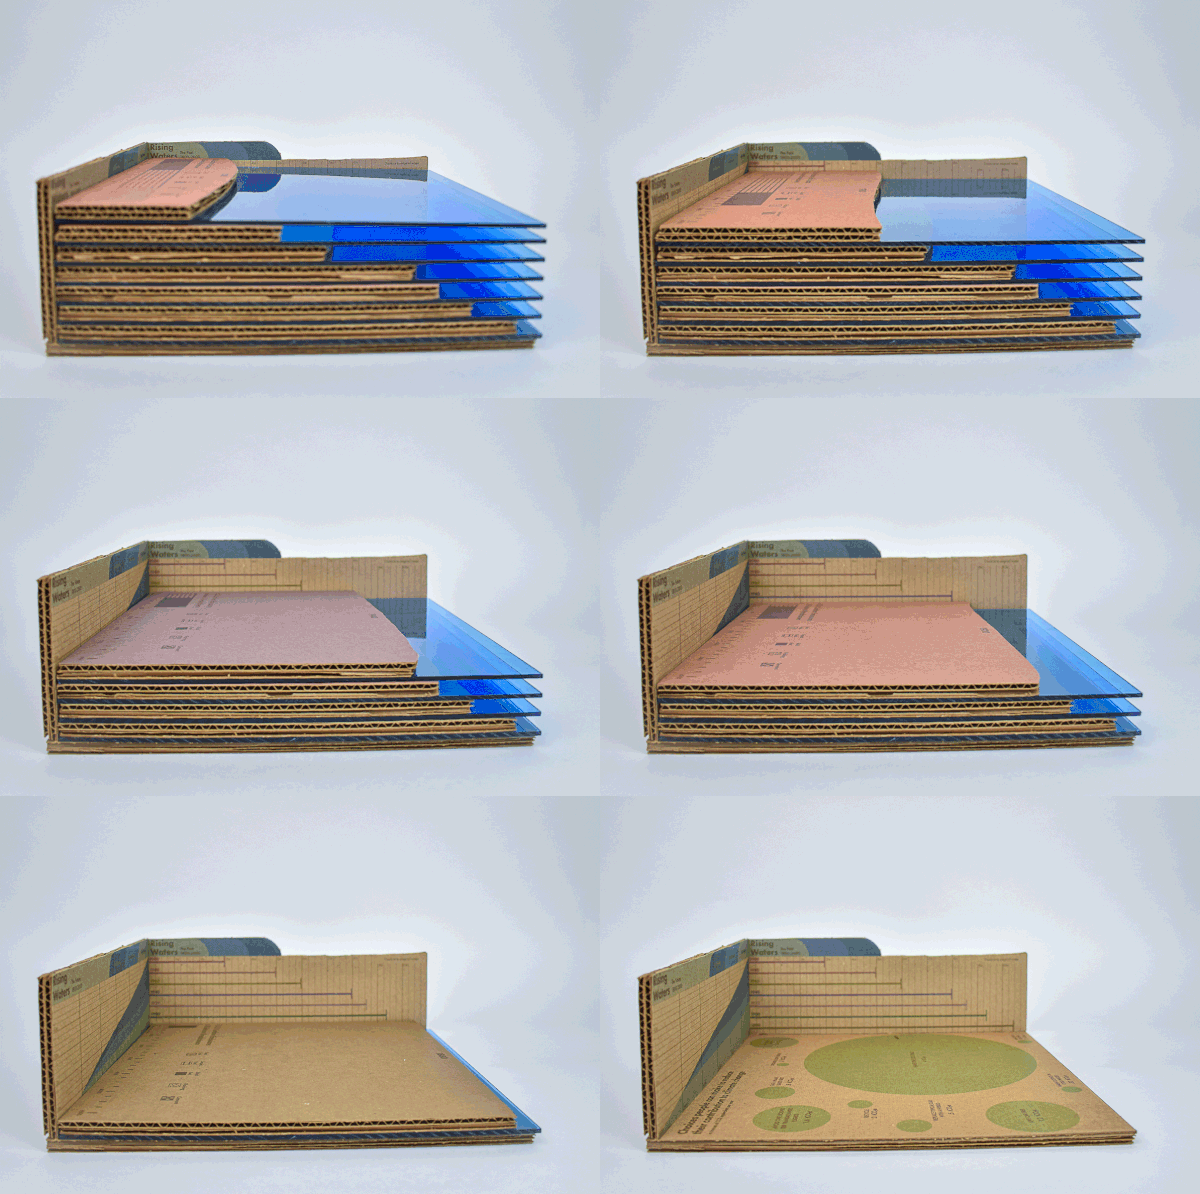

For this project, students chose a uncharted territory to map. It can be a conversation, a natural phemnomena, a social network, or painting. The format is up to them, they are encouraged to explore physical, digital, and motion based solutions.
COMMUNITY HEALTH
REPORT
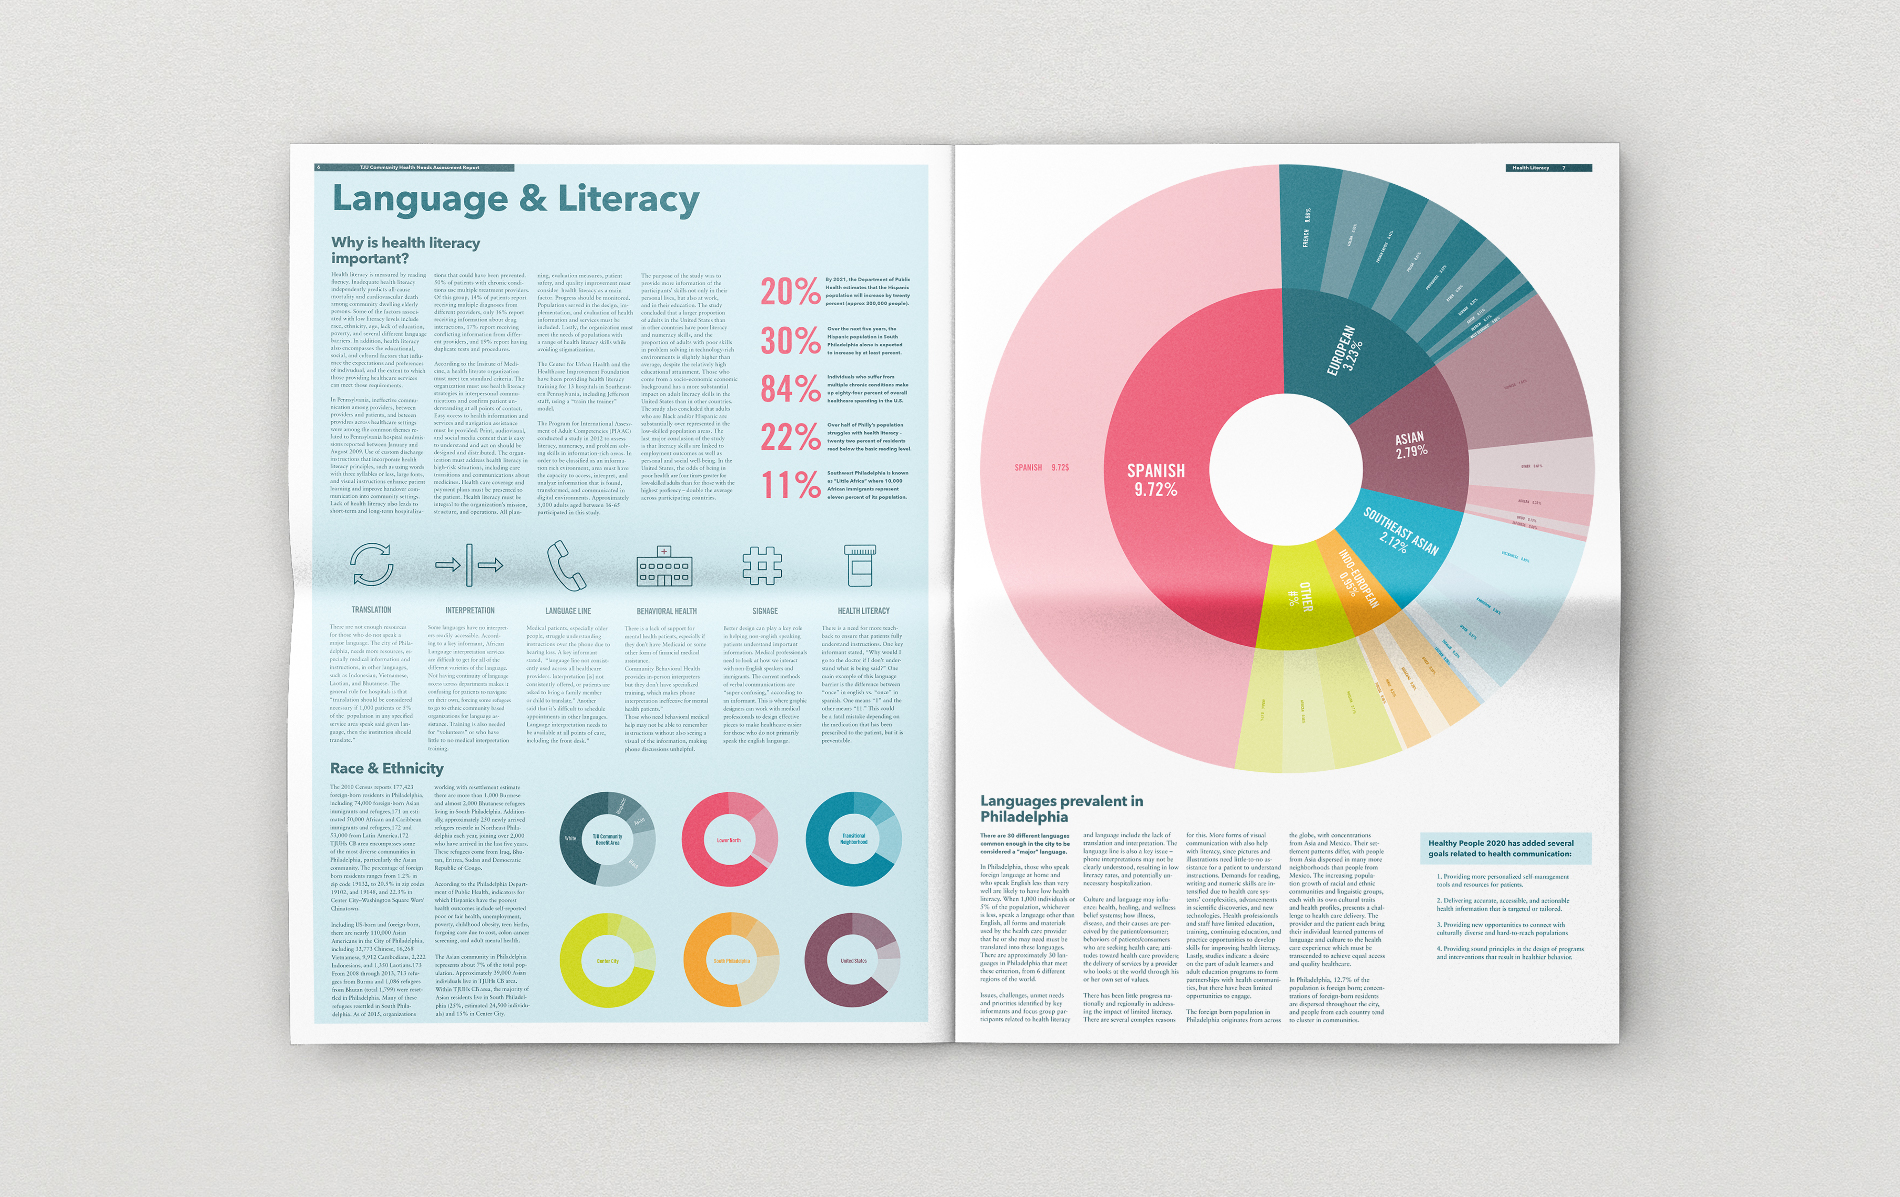
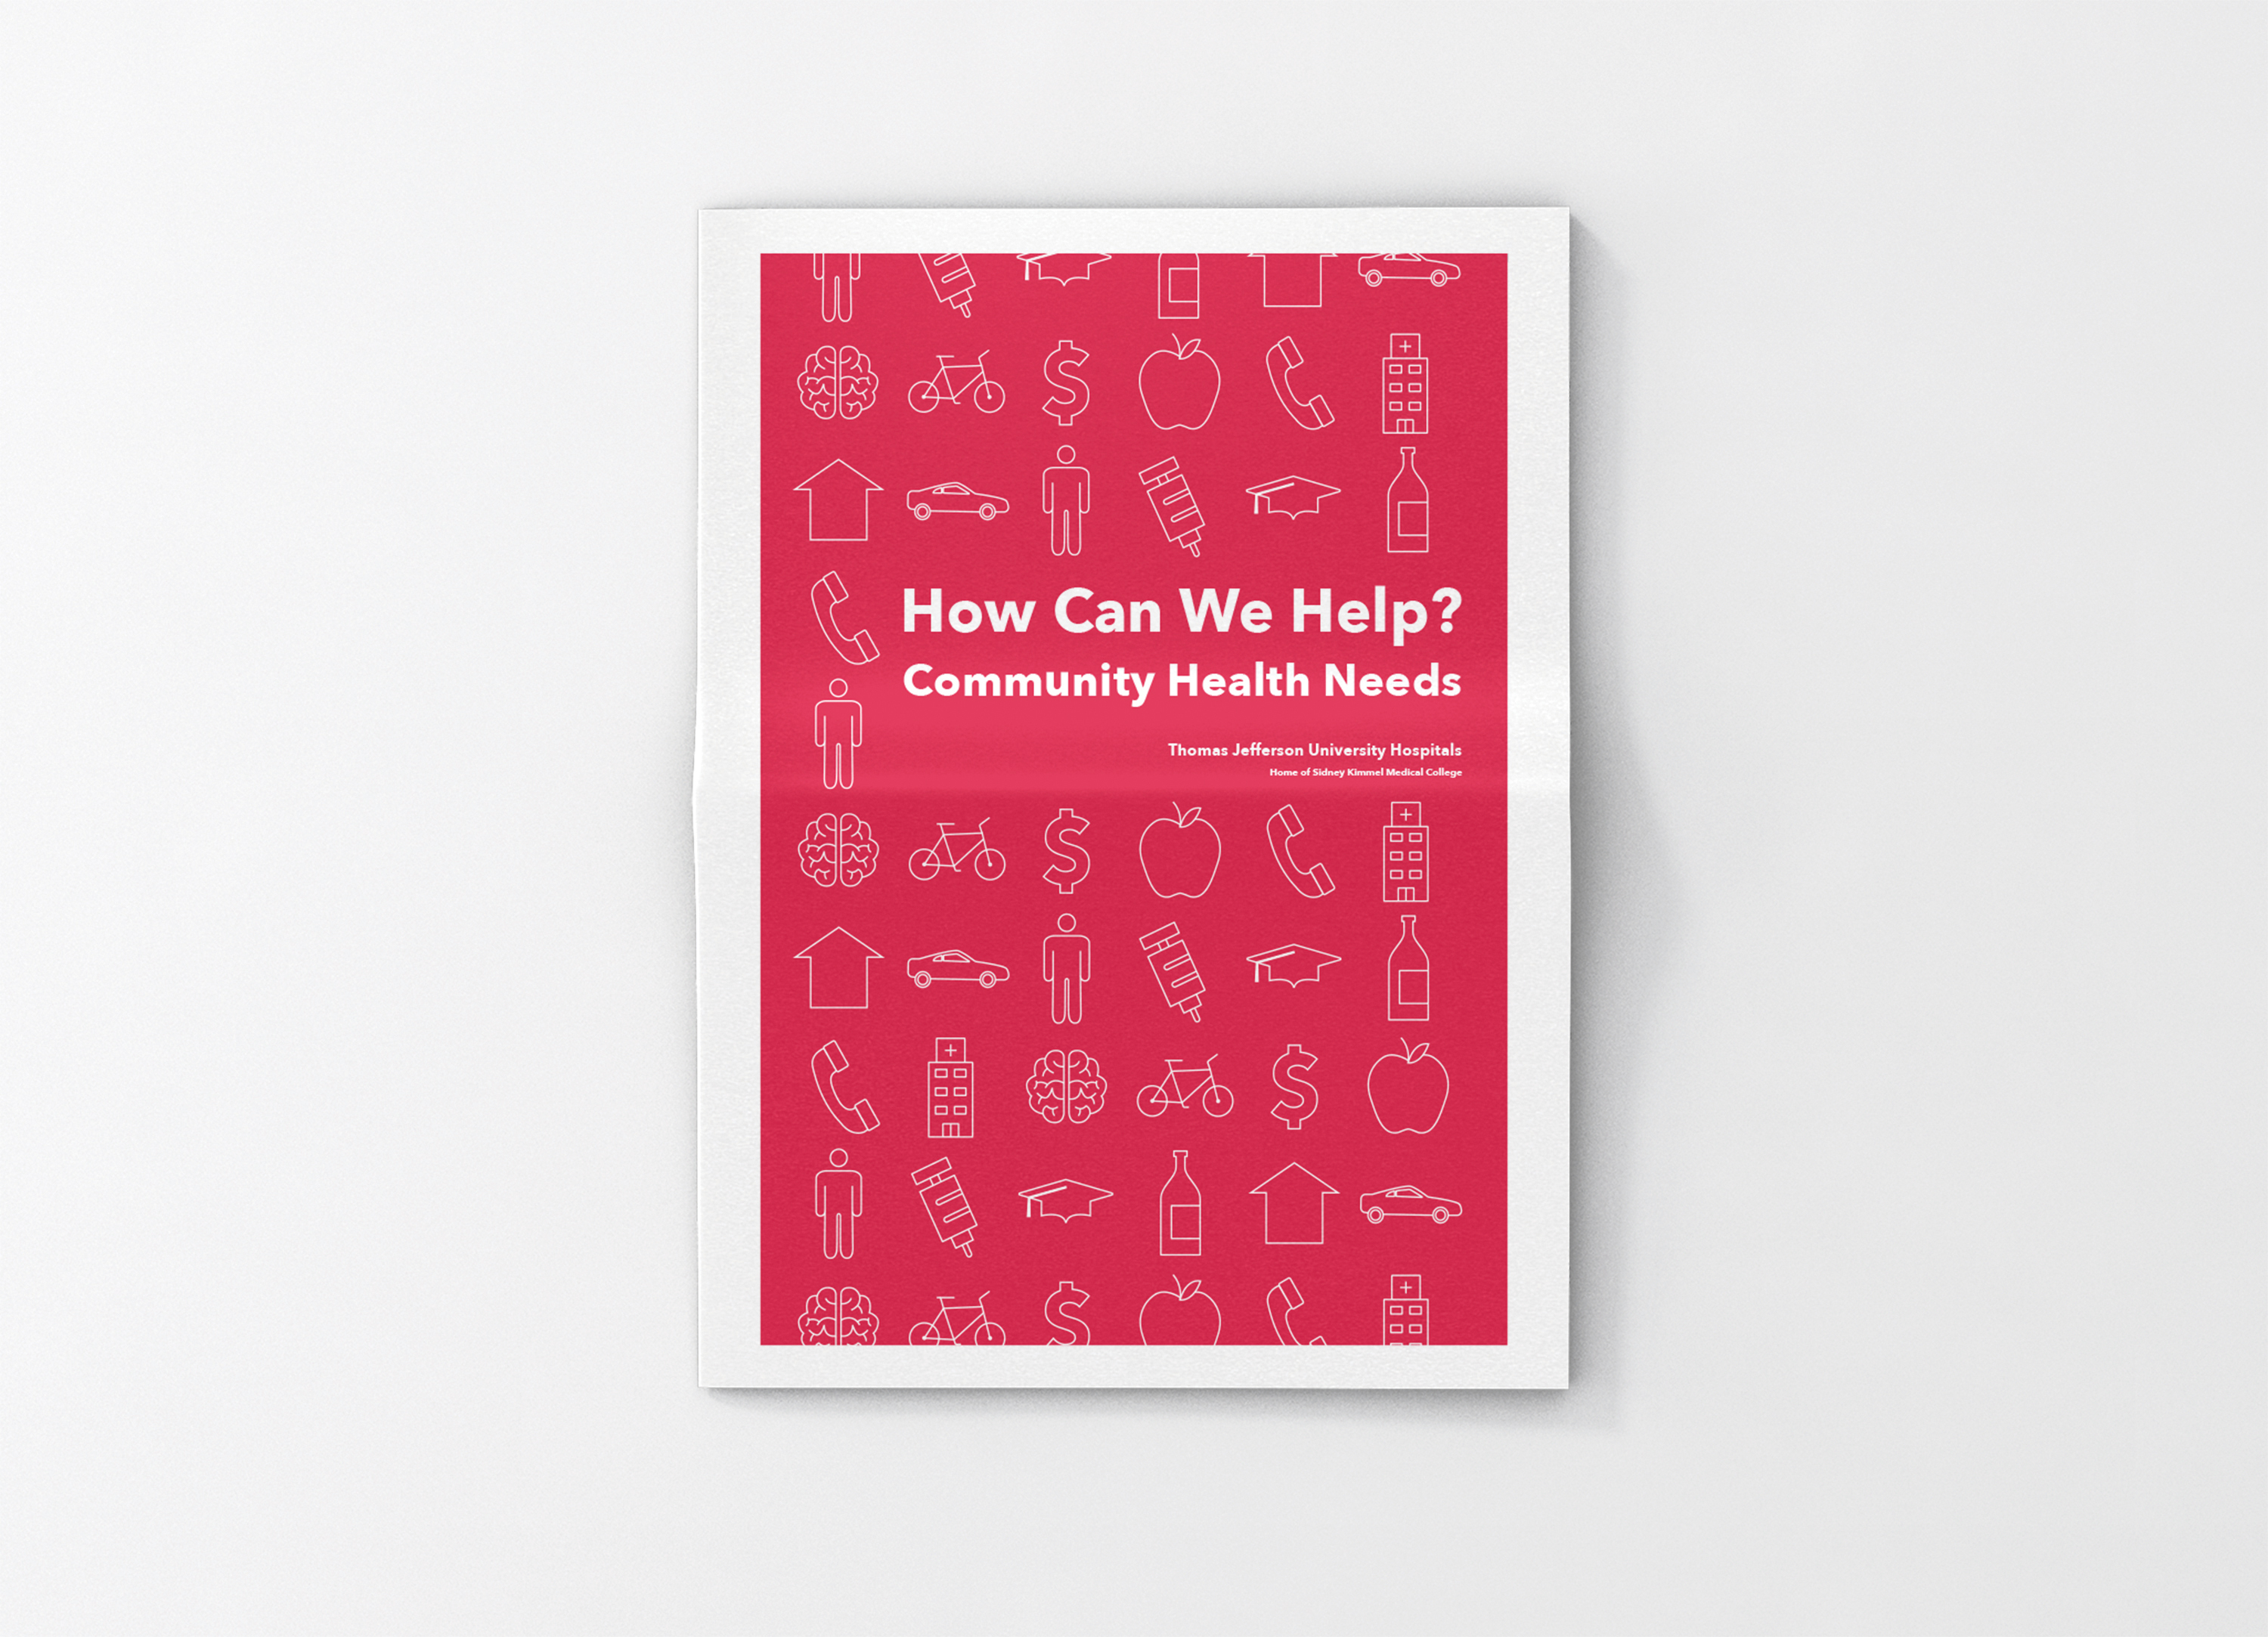
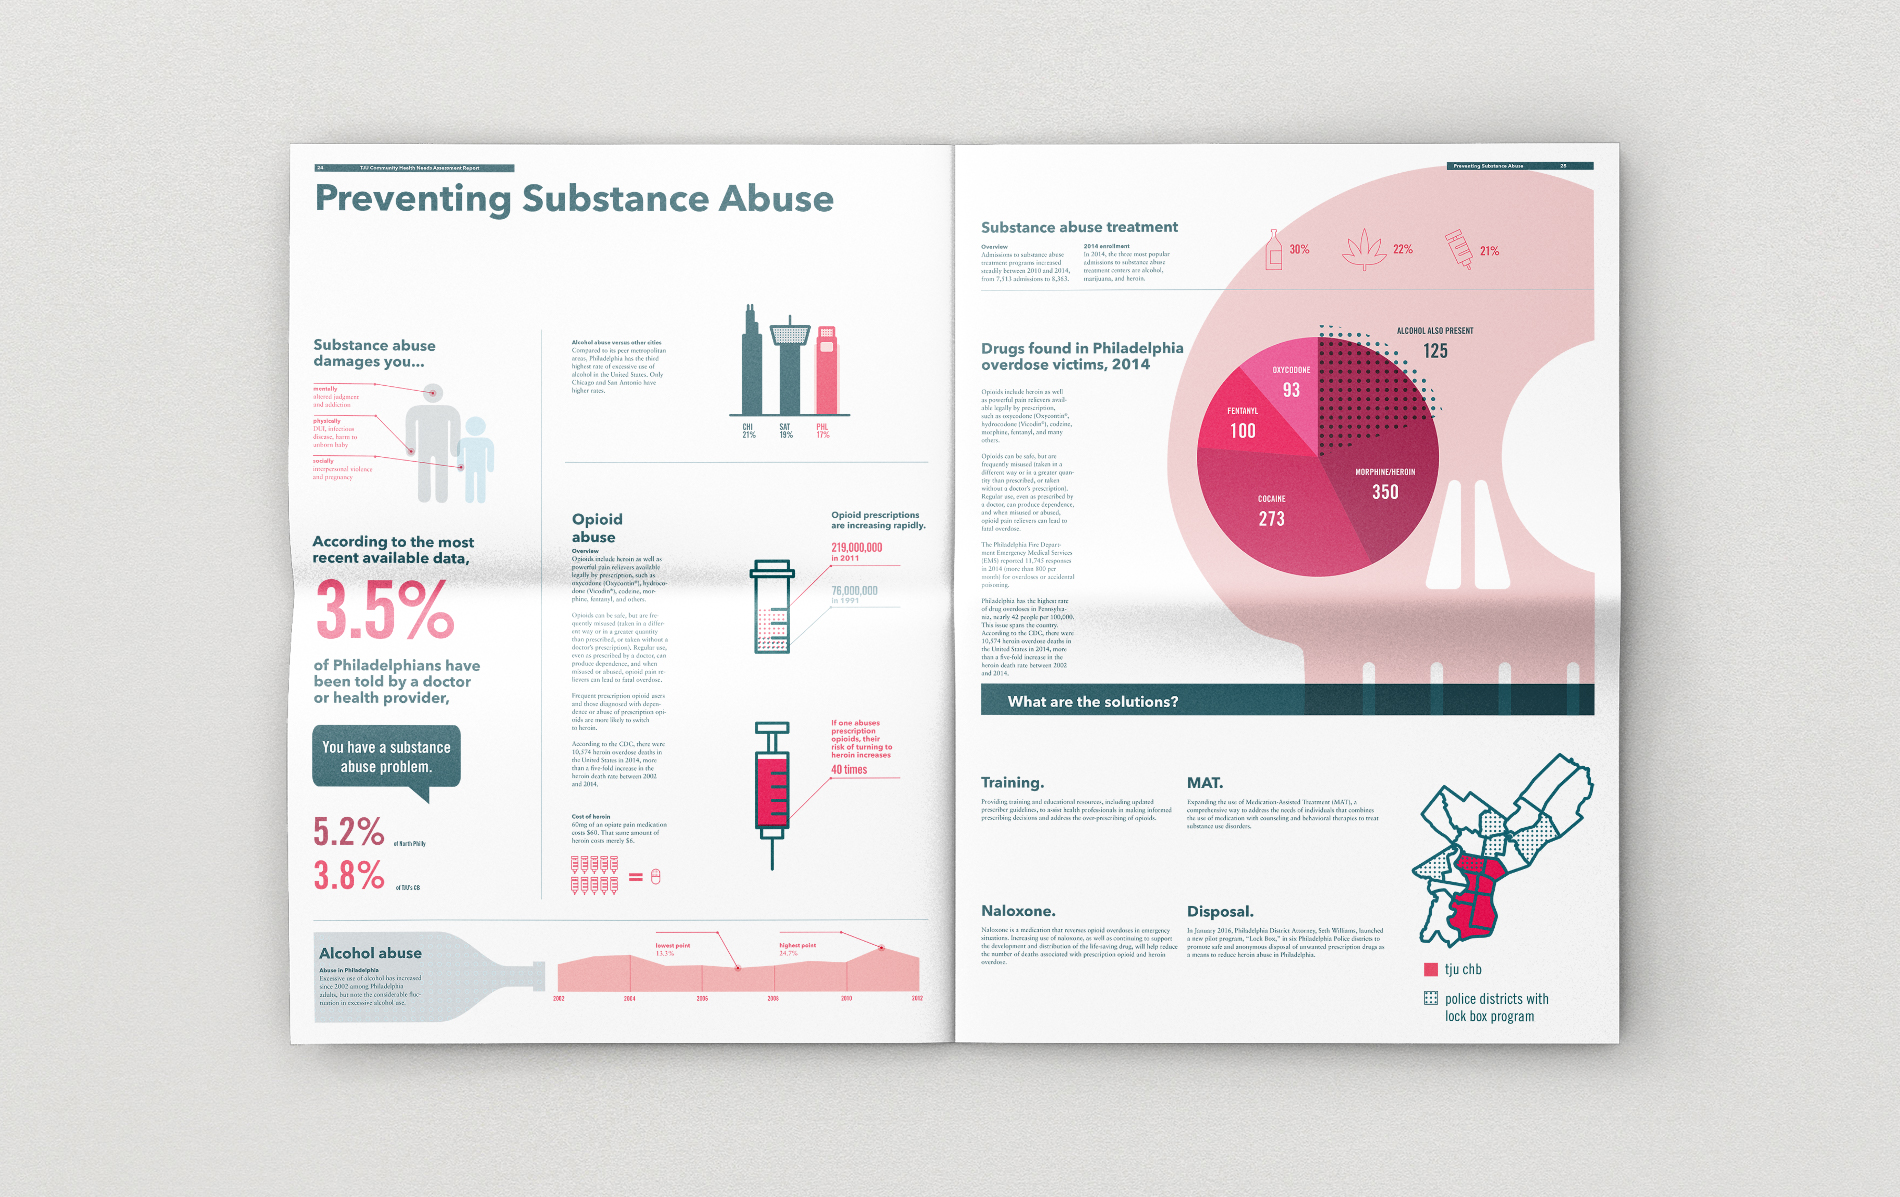

In a collaboration with the Jefferson Center for Urban Health, students each took on a topic covered in the report and represented the data provided in a visual explanation. Solutions ranged in approach from visual breakdowns of languages spoke by the community to maps displaying economic density in Philadelphia’s neighborhoods. A dissection of the sodium levels the Philadelphians’ favorite cheesesteak helped make the content relatable to the community. Students collaborated to come up with a look and feel for publication in a broadsheet format.